


consumer confidence report water
Water Report Units Explained: ppb, ppm, MCL, Range

A water report becomes more useful when you can translate its units and comparison columns. A small number can still matter when it is reported in parts per billion, and a result marked “ND” does not always mean an absolute zero.
This guide focuses on report math and labels rather than recommending a filter. Use it to distinguish ppm from ppb, an enforceable limit from a health goal, and an annual average from the highest observed result.
Locate the Sampling Source and Reporting Period
First, find where your water comes from. Your report should say whether your utility uses groundwater, surface water, purchased water, or a blend. That matters because each source tends to carry different risks.
Groundwater often moves through rock, soil, and old infrastructure before it reaches a treatment plant. Depending on your area, that can mean minerals, arsenic, nitrate, radium, hardness, iron, or sulfur-related taste and odor issues. Surface water from rivers, reservoirs, and lakes can be more exposed to runoff, algae, organic matter, and seasonal changes.
Do not treat this section as trivia. It tells you which parts of the report deserve the most attention. If your water comes from multiple sources, look for language like “seasonal blend,” “interconnection,” or “emergency source.” Those notes can explain why your water tastes different at certain times of year.
A good first pass is simple:
- Write down your source type.
- Note whether the utility changed sources during the reporting year.
- Circle any source-water notes about runoff, industry, agriculture, or older service lines.
- Save the report as a PDF so you can compare next year’s numbers.
If you do not receive a report, search your utility name plus “consumer confidence report” or “water quality report.” Renters can often find it through the city, county, or water provider website.
Translate MCL, MCLG, Action Level, and Detection Limit
Water reports use shorthand that looks more technical than it needs to be. Four terms are worth knowing.
MCL means maximum contaminant level. It is the enforceable legal limit for a regulated contaminant in public drinking water. If the report says a contaminant is below the MCL, the utility met that federal standard for the reporting period.
MCLG means maximum contaminant level goal. This is not enforceable. It is a health-based goal set without considering treatment cost or technical limits. In plain language, the MCL is the legal line; the MCLG is a target used by regulators.
AL means action level. You will often see it with lead and copper. An action level does not mean every home has the same level at the tap. It means the utility must take added steps if too many tested homes exceed that level.
Detection limit is the lowest amount a lab method can reliably report. If a contaminant is marked “ND,” it usually means not detected at or above that method’s reporting limit. It does not always mean zero.
This is why “legal” and “not present” are not the same thing. A water report helps you see whether your utility met standards. A filter decision is about what you want removed at your own tap.
Convert Units Before You Compare Results
The easiest way to use a report is to group contaminants by the type of filter that addresses them.
For drinking water, pay close attention to lead, arsenic, fluoride, nitrate, total dissolved solids, PFAS, volatile organic compounds, and disinfection byproducts such as TTHMs and HAA5. A properly selected reverse osmosis system is often the first technology homeowners research for dissolved contaminants because RO uses a semi-permeable membrane, not just carbon adsorption.
For taste, odor, and chlorine or chloramine concerns, carbon filtration matters. Carbon can improve taste and reduce certain chemicals, but a basic carbon filter is not the same as reverse osmosis. If your report shows dissolved contaminants, do not assume a pitcher or refrigerator filter handles the full list.
For whole-home concerns, look for hardness, iron, sediment, manganese, chlorine, chloramine, and service-line-related notes. These can affect fixtures, appliances, laundry, shower feel, and water entering every room. Whole-house treatment is about the water supply to the home; point-of-use treatment is about the water you drink and cook with.
PFAS deserves a separate note because public awareness and regulation changed fast. EPA finalized the first national drinking water regulation for several PFAS in 2024, and public water systems have compliance deadlines ahead under the PFAS drinking water rule. If your report includes PFAS monitoring, read the numbers and units closely. If it does not, that absence may reflect monitoring schedule, reporting timing, or state rules, not a guarantee that PFAS has never been found nearby.
Use the Range to See What an Average Can Hide
Many homeowners look only at the average column. Do not stop there. The range column tells you the low and high results from samples taken during the year.
A contaminant may average below a limit while still showing a high sample that is close to the line. That is not automatically a violation, but it is useful context. If a result spikes during summer, after storms, or during source blending, it can explain why taste and odor change even when the utility remains compliant.
Also look at units. Drinking water reports may use ppm, ppb, ppt, mg/L, ug/L, or pCi/L. A tiny number can still matter if the unit is parts per trillion. Do not compare numbers across contaminants without checking the unit first.
Here is a practical reading order:
- Start with contaminants detected, not the ones reported as not detected.
- Compare the highest reported result to the MCL or action level.
- Note the MCLG when it is lower than the enforceable limit.
- Watch for year-over-year movement if you have old reports.
- Mark anything near a limit, newly detected, or repeatedly present.
This turns a dense PDF into a short action list.
Mark the Questions the Report Cannot Answer
A Consumer Confidence Report is useful, but it does not test every home’s faucet. It represents the public water system and the required sampling points. Your building’s plumbing, fixture aerators, water heater, refrigerator line, service line, and storage conditions can all change what reaches your glass.
Lead is the clearest example. Lead often comes from plumbing materials and service lines, not from water leaving the treatment plant. That is why two houses on the same street can have different tap results.
The report also may not include private well data because private wells are not regulated the same way public water systems are. EPA notes that private well owners are responsible for testing and maintenance, while public-system rules apply to regulated utilities in its private well guidance.
Finally, the report is historical. It usually summarizes last year’s data. If your area had recent road work, flooding, a main break, hydrant flushing, a source change, or a boil-water notice, check current utility alerts too.
Connect a Verified Result to a Treatment Claim
Once you have your short list, choose the filter path by problem type.
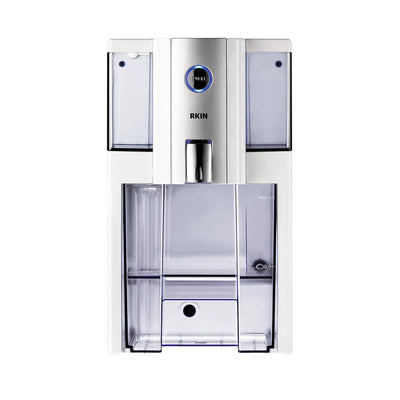
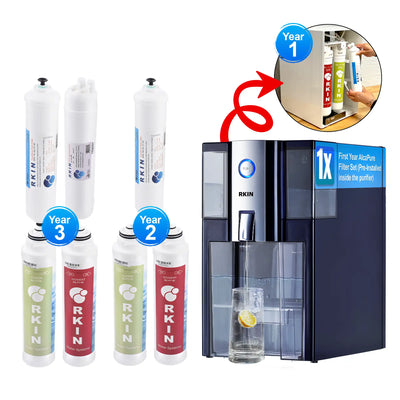
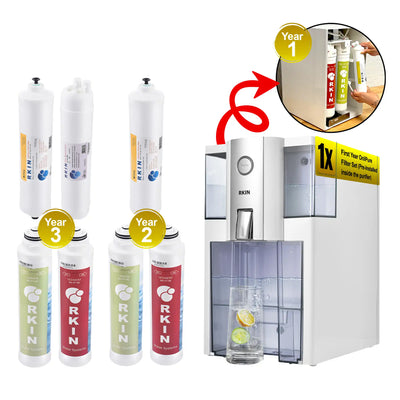
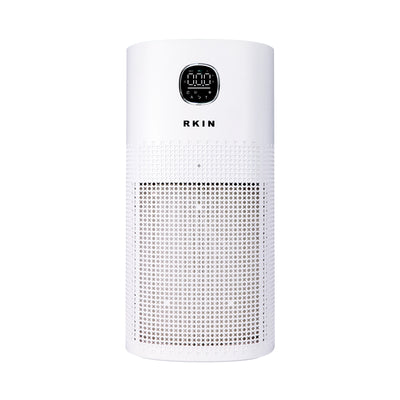
If your main concern is drinking and cooking water, reverse osmosis is usually the place to start. The RKIN Zero Installation Purifier is designed for renters, apartments, and homeowners who want RO drinking water without plumbing changes. It sits on the counter and avoids permanent installation.
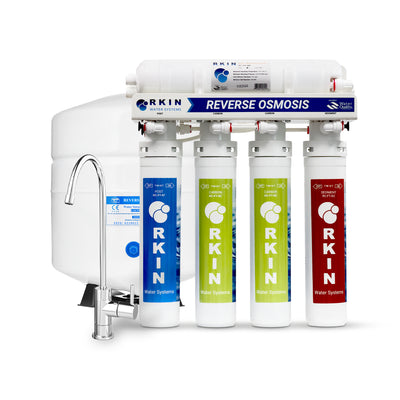
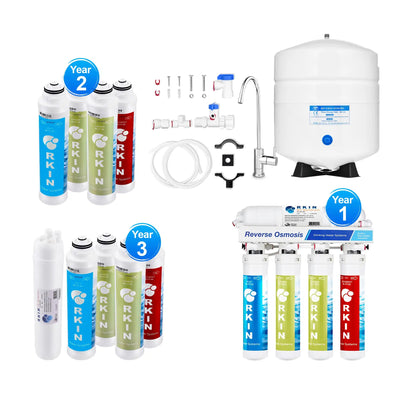
If you want an undersink setup for a dedicated faucet, the RKIN Flash Undersink RO System fits homes where a cold-water-line connection makes sense. That is a better fit when you want filtered drinking water built into the sink area.
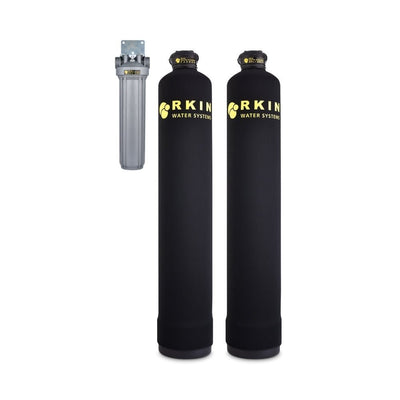
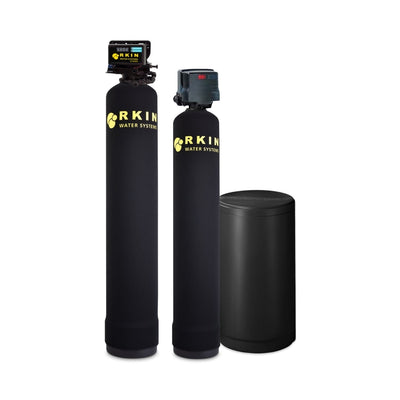
If the report points to whole-home issues such as chlorine taste throughout the home, sediment, hardness clues, or water that affects fixtures and appliances, start with the RKIN whole-house water treatment collection or schedule a consultation. The right system depends on flow rate, bathrooms, water source, and test results.
Do not buy from a single number. A smart filter choice comes from three inputs: the annual report, your home’s plumbing conditions, and any tap-specific test results.
Know When a Tap Sample Adds Useful Evidence
Test your tap when the report leaves a gap, when your home has older plumbing, or when taste, odor, staining, or sediment changes suddenly. Tap testing is also helpful if you are pregnant, preparing formula, moving into an older home, or dealing with a private well.
Choose the test based on the concern. A basic city-water screen may not include PFAS. A bacteria test may not include metals. A TDS meter does not identify which dissolved substances are present. If you already have a water report, use it to choose a targeted test instead of guessing.
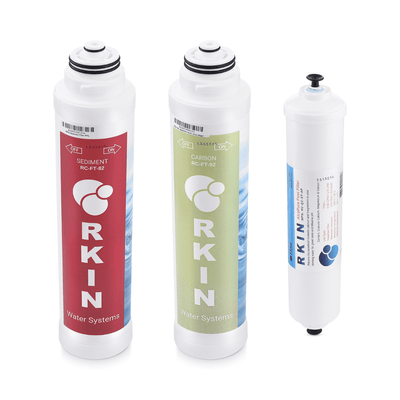
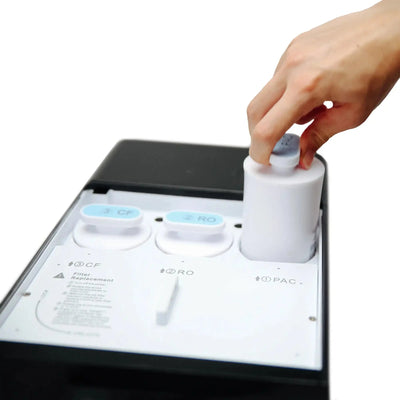
Keep your report, test results, photos of plumbing, and filter model numbers in one folder. That makes yearly decisions much easier and prevents buying the wrong replacement filter cartridges later.
Work Through One Result at a Time
Choose one contaminant row and copy it into a simple note. Record the result, unit, regulatory benchmark, range, sample period, and any footnote tied to that row.
Never compare two numbers until their units match. One part per million equals 1,000 parts per billion, so a decimal in ppm can represent a much larger ppb value than it first appears.
- Confirm whether the result is an average, maximum, percentile, or single sample.
- Convert ppm and ppb to the same unit before comparing values.
- Read every symbol and footnote connected to the result.
- Note whether the benchmark is an MCL, MCLG, action level, or advisory.
- Use the contaminant name—not only the category—to verify a filter claim.
If the report is a community-wide snapshot, it may not describe changes from your building’s plumbing. A targeted tap sample can answer that different question.
Frequently Asked Questions
How many ppb are in 1 ppm?
One part per million equals 1,000 parts per billion. Convert values to the same unit before comparing them.
Does ND on a water report mean zero?
Usually it means the substance was not detected above the laboratory's stated reporting or detection limit. Check the report's definitions.
Is the MCL the same as the MCLG?
No. The MCL is an enforceable drinking-water limit, while the MCLG is a non-enforceable health goal.
Why should I read the reported range?
A range can show seasonal or sampling variation that an annual average alone may hide.
Can a city water report describe my kitchen tap exactly?
Not always. It describes the utility's system and reporting period; building plumbing can add a separate variable.
Use the Number to Define the Treatment Question
Once the unit and benchmark are clear, compare only treatment claims that name the same substance and test method. RKIN can help you sort countertop, under-sink, and whole-home layouts after the report has defined the problem.






0 comments